Welcome to The 4N Chart
A 4N Chart is a simple and powerful visual mapping tool used in system design, operation and improvement.
To use the 4N Chart:
1. Ask "What is the feeling associated with a Nugget or Niggle?"
2. Ask "What happened just before that feeling appeared?"
3. Keep asking "And what happened just before that?" until a causal pattern has emerged.
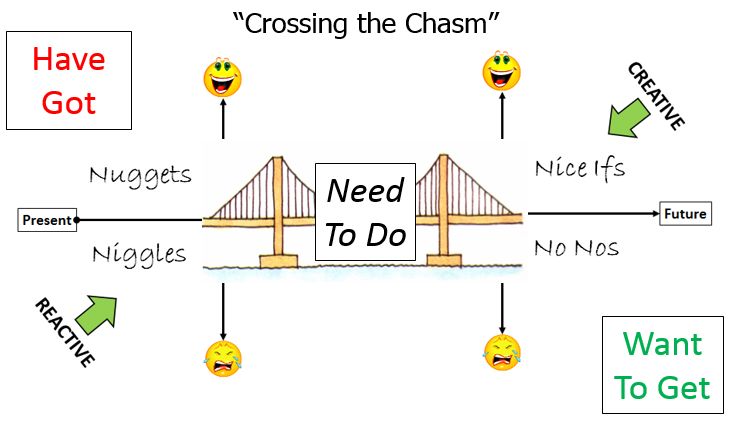
The 4N Chart is a form of causal structure map (CSM). So, to get the effects we want we need to focus our efforts on the causes that we can control.
To feel better in the present we focus on amplifying the causes of Nuggets and eliminating the causes of Niggles. And to feel even better in the future we need to create a context for NiceIfs to be achieved and for NoNos to be avoided.
To download the 4N Chart Action Card click here
| saasoft.co.uk | 20th December 2022 |